Introduction: Navigating the Investment in Automation
The global hygiene products market is projected to maintain steady growth through 2026, driven by rising populations, increasing health awareness, and disposable incomes in emerging economies. For business owners and investors in regions like South America, Southeast Asia, and the Middle East, investing in a fully automatic diaper production line represents a significant strategic move. However, the decision extends far beyond comparing initial price tags from different companies. A thorough, professional cost analysis is the cornerstone of a viable business plan, separating profitable ventures from capital-intensive missteps.
The Shift to Automation: Why Cost Analysis is Critical in 2026
In 2026, automation is no longer a luxury but a necessity for competing in the hygiene sector. Fully automatic lines offer unparalleled consistency, higher output with fewer workers, and superior product quality. Yet, the capital outlay is substantial. A nuanced cost analysis must transition from simple machine pricing to a holistic Total Cost of Ownership (TCO) model. This includes capital expenditure (CAPEX), operational expenditure (OPEX), hidden costs, and a clear projection of Return on Investment (ROI) under realistic market conditions. This guide is designed to provide that depth.
Who This Guide is For: From First-Time Buyers to Seasoned Procurement Managers
Whether you are a product agent scouting reliable equipment for a client, a wholesale distributor integrating backward into manufacturing, or a corporate procurement manager for a large retail chain, this guide offers actionable insights. We blend operational guides with cost breakdowns, case studies, and trend analysis to cater to both newcomers and industry veterans looking to make data-driven decisions in 2026.
1. Deconstructing the Total Investment: A Line-by-Line Breakdown
The quoted price for a line is just the starting point. A professional cost analysis dissects every component.
1.1 Core Machinery Costs: Beyond the Sticker Price
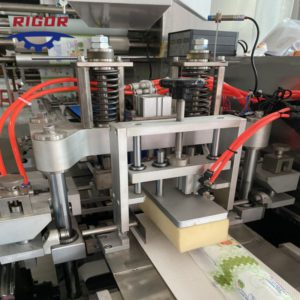
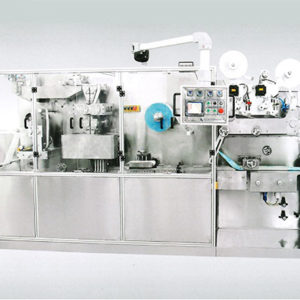
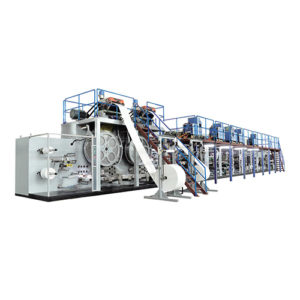
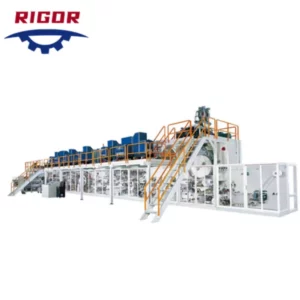
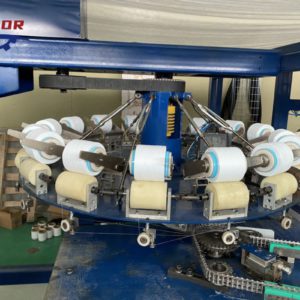
A complete fully automatic baby diaper production line typically includes: a pulp core forming unit, SAP and fluff pulp dosing system, non-woven and backsheet application, elastic leg application, ultrasonic or hot melt bonding, cutting and shaping, stacking, and packaging units. In 2026, prices for a standard line producing 400-600 pieces per minute can range from $280,000 to $550,000, heavily dependent on speed, configuration, and brand origin.
Key factors affecting this core cost:
– Speed & Output: A 800 PPM line can be 40-60% more expensive than a 400 PPM line, but unit cost plummets.
– Degree of Automation: Lines with automatic defect detection, servo-driven tension control, and integrated QA systems command a 15-25% premium.
– Brand & Origin: European-engineered lines are often at the premium end, while technologically mature Chinese manufacturers offer competitive advanced at a lower CAPEX, a crucial consideration for cost-sensitive markets.
1.2 The Hidden & Often Overlooked Costs (The Silent Budget Killers)
Failing to budget for these items is a common trap. They can add 25-40% to your initial machinery quote.
– Shipping, Insurance, and Customs Clearance: Varies dramatically by destination. Import duties for industrial machinery can be 5-15% in Southeast Asia, higher in some South American countries. Always use CIF/DDP incoterms for clarity.
– Installation & Commissioning: Requires factory engineers. Budget $15,000-$30,000 for travel, accommodation, and service fees for 2-3 weeks.
– Factory Modifications: Electrical upgrades (380V/440V, stable power supply), compressed air systems (≥0.7MPa), concrete flooring reinforcement, and climate control (for SAP storage) are often needed.
– Initial Spare Parts Kit: A mandatory 1-2% of machine cost for critical wear parts like sealing horns, ultrasonic generators, and cutting blades.
– Training: Operator and maintenance training is essential for efficiency. Factor in costs for manuals and simulator time.
1.3 Regional Cost Variations: South America vs. Southeast Asia vs. Middle East
Your geographic location directly impacts cost structures. A line destined for Brazil faces different challenges than one for Vietnam or Saudi Arabia.
– South America: High freight costs, complex import bureaucracy in some countries, but strong local demand. Potential for Mercosur trade benefits.
– Southeast Asia: Generally lower import duties within ASEAN, competitive local labor for operators, but requires robust humidity control for pulp-based materials.
– Middle East & Africa: Priority on machine durability for harsh climates, potential for tax-free zones (like JAFZA, UAE), but higher costs for skilled expatriate technicians during setup.
Pro Tip: Always request a localized, all-inclusive quotation from your that specifies responsibilities up to the point of production-ready operation.
2. Operational Cost Drivers: The Real Determinants of Profitability
Once the line is running, ongoing OPEX determines your margin. Let's analyze the key drivers.
2.1 Raw Material Consumption & Yield: The Science of Waste Reduction
Raw materials (fluff pulp, SAP, nonwoven, film, adhesives) constitute 60-75% of the total production cost. A high-precision, stable machine directly reduces waste.
– Yield Optimization: Modern servo-controlled systems can achieve a material yield of over 98.5%. A difference of just 1% in waste on a line consuming $100,000 of materials monthly equals $12,000 annually.
– SAP Dosing Accuracy: Precise SAP dosing (critical for absorbency) prevents giveaway (cost) or under-dosing (product failure). Look for machines with pneumatic or advanced volumetric dosing systems with ≤±2% accuracy.
– Case Study from Our Experience: A client in the Philippines was experiencing a 4.5% over-consumption of nonwoven fabric due to inconsistent tension control on their older line. After upgrading to a servo-driven unwinding system on our recommended line, waste reduced to 1.2%, paying back the modification cost in under 8 months.
2.2 Labor, Energy, and Maintenance: A 5-Year Projection Model
Automation's primary OPEX benefit is labor reduction, but energy and maintenance are critical.
| Componente de coste | Semi-Automatic Line | Fully Automatic Line | Notes |
|---|---|---|---|
| Operators Required | 10-15 | 3-5 | Major saving in wages & benefits |
| Power Consumption (kWh) | ~12,000 | ~18,000 | Higher due to more motors & servos |
| Compressed Air (m³) | Low | High | Critical for pneumatic controls |
| Routine Maintenance | Moderate | Higher skill required | Predictive maintenance reduces downtime cost |
| Annual Maintenance Cost (% of machine price) | 1-2% | 2-3.5% | For parts & scheduled service |
Energy costs are rising globally. In 2026, investing in machines with IE3/IE4 class high-efficiency motors and regenerative drives can cut energy consumption by 15-20%.
2.4 Downtime Cost Analysis: Why Machine Reliability is Non-Negotiable
Unplanned downtime is the single largest profit killer. If a $500,000 line producing $10,000 of goods daily is down for one day, you lose that revenue plus incur fixed costs.
– Mean Time Between Failures (MTBF): A key metric to demand from your . Quality lines should have an MTBF of over 1,000 hours for critical components.
– Technical Support Response Time: For markets like Russia or South Africa, local or regional technical support is vital. A 24/7 remote support guarantee and a stocked local spare parts depot can reduce downtime from weeks to hours.
– Our On-Ground Lesson: We once assisted an Egyptian client whose line was halted by a faulty PLC module. The European supplier's lead time for the part was 3 weeks. Because we had recommended a supplier with modular, widely available components (e.g., Siemens PLCs) and a regional warehouse in Turkey, the part was air-shipped and installed in 3 days, saving an estimated $150,000 in lost production.
3. The ROI Blueprint: Calculating Your Break-Even and Profit Timeline
ROI is the ultimate measure of your investment's success. Here is a practical methodology for 2026.
3.1 A Step-by-Step ROI Calculation Methodology for 2026
1. Calculate Total Capital Investment (TCI): Core machine cost + Hidden costs (Section 1).
2. Estimate Annual Operational Savings & Additional Profit: (Labor savings + Material yield improvement + Reduced defect rate) + (Increased output volume * profit margin).
3. Deduct Annual OPEX Increase: Higher energy, maintenance, and depreciation costs.
4. Compute Annual Net Cash Flow: Step 2 – Step 3.
5. Calculate Simple Payback Period: TCI / Annual Net Cash Flow.
6. For a more refined view, calculate Net Present Value (NPV) using a discount rate (e.g., 10%) over 5-7 years.
A realistic payback period for a fully automatic line in a growing market in 2026 is typically 2.5 to 4 years.
3.2 Case Study: ROI Analysis for a Mid-Scale Plant in Colombia
Scenario: A distributor in Bogotá invests in a 500 PPM fully automatic line to supply local supermarkets.
– TCI: $420,000 (Machine: $350,000, Shipping/Install/Spares: $70,000).
– Replaces a semi-automatic line with 12 operators. Labor saving: 8 operators @ $18,000/yr each = $144,000/year.
– Material yield improves from 95% to 98%, saving $28,000/year on materials.
– Output increases by 40%, generating additional net profit of $85,000/year.
– Additional energy & maintenance cost: $25,000/year.
– Annual Net Cash Flow: ($144k + $28k + $85k) – $25k = $232,000.
– Simple Payback Period: $420,000 / $232,000 ≈ 1.8 years.
This strong ROI is achievable with efficient market penetration, which the increased output and consistent quality enable.
3.3 Sensitivity Analysis: How Market Fluctuations Impact Your Returns
ROI is not static. Test your model against:
– Raw Material Price Increase (+15%): Could reduce annual cash flow by ~10%.
– Lower-than-expected Capacity Utilization (80% instead of 90%): Extends payback period significantly.
– Local Currency Depreciation: If importing machinery in USD, a 20% currency drop increases local currency TCI by 20%.
Building a 10-15% contingency into your projections and having a flexible business model (e.g., ability to produce multiple product types) mitigates these risks.
4. Comparative Analysis: Full Automatic vs. Semi-Automatic Lines
The choice isn't always obvious. Let's compare from a total cost perspective.
4.1 Upfront Cost vs. Long-Term Value: A 10-Year TCO Perspective
While a semi-auto line may cost 40-60% less initially, its 10-year TCO often tells a different story.
– Labor: The dominant recurring cost. Over 10 years, the wage differential can exceed the initial price of the full-auto line.
– Consistency & Reject Rate: Semi-auto lines typically have a reject rate of 2-5%, compared to <1% for full-auto. This waste accumulates.
– Scalability: A full-auto line can often be upgraded in speed or functionality; a semi-auto line usually requires complete replacement to scale.
For markets with rising labor costs and competitive quality demands (e.g., Middle East, major Southeast Asian cities), the full-auto line's TCO becomes superior within 3-5 years.
4.2 Output, Quality, and Scalability: The Tangible Differences
Beyond cost, consider strategic capability.
– Output: A full-auto line runs 24/7 with minimal crew changeover. A 500 PPM line can produce over 200 million diapers annually in 3 shifts.
– Quality: Automated processes ensure uniform SAP distribution, bonding strength, and shape consistency—critical for brand reputation.
– Product Diversification: Many modern full-auto lines from a capable can be configured to also produce sanitary pads or pant-type diapers with quick changeover kits, opening multiple revenue streams from one capital asset.
4.3 Decision Matrix: Which Line is Right for Your Market Segment?
Use this framework to guide your choice:
– Choose Semi-Automatic if: You are a true startup with very limited capital, targeting a local/niche market with low volume, labor costs are extremely low, and product consistency requirements are basic.
– Choose Fully Automatic if: You aim to supply modern retail chains or export, compete on brand quality, operate in a region with medium/high labor costs, have a clear path to scale within 5 years, or plan to produce both diapers and .
For most professional investors and distributors in our target regions for 2026, the fully automatic line is the definitive choice for building a sustainable, competitive business.
5. Top 7 Costly Mistakes and How to Avoid Them
Learning from others' expensive errors is the cheapest form of due diligence.
5.1 Mistake #1: Underestimating Installation and Commissioning
Believing the machine will be productive immediately upon arrival is a fantasy. Without proper foundation, power, and air, the line sits idle. How to Avoid: Work with the manufacturer to complete a detailed site survey checklist 3 months before shipment. Agree on a fixed-price, turnkey installation contract with clear milestones.
5.2 Mistake #3: Neglecting Local Technical Support and Spare Parts Logistics
Choosing a supplier based solely on the lowest FOB price, without considering after-sales infrastructure in your region, is a high-risk strategy. How to Avoid: Verify the existence of a regional service center or a dedicated local partner. Ask for a list of common spare parts stocked within your country or a neighboring hub. Demand clear Service Level Agreement (SLA) for response times.
5.3 Mistake #5: Overlooking Compliance and Certification Costs
Importing machinery without the correct certifications (e.g., CE for electrical safety, local pressure vessel certification for air tanks) can lead to customs holds, fines, or inability to get insurance. How to Avoid: Specify required certifications in your purchase contract. For example, "Machine must be supplied with full CE documentation and certification, validated for [Your Country]'s voltage and frequency standards." Budget for any required local re-inspection fees.
6. Future-Proofing Your Investment: 2026 Trends with Cost Implications
An investment today must remain relevant and efficient for the next decade.
6.1 Smart Manufacturing & IoT: The Path to Predictive Maintenance and Lower OPEX
The integration of Industrial Internet of Things (IIoT) sensors is becoming standard on advanced lines. These sensors monitor vibration, temperature, and pressure on key components like servo motors and ultrasonic welders. Data is fed to a dashboard, predicting failures before they happen (e.g., a bearing showing unusual heat). This transforms maintenance from reactive to predictive, potentially reducing unplanned downtime by up to 30% and cutting maintenance costs by 10-15%. In 2026, opting for a machine with this connectivity is a direct OPEX-saving measure.
6.2 Sustainable Materials and Energy Efficiency: Regulatory and Cost Drivers
Consumer and regulatory pressure for sustainable hygiene products is growing. This means machines must handle new, often more challenging, raw materials: bio-based films, chlorine-free fluff pulp, and thinner yet stronger nonwovens. A machine designed only for traditional materials may struggle, causing waste and downtime. Furthermore, energy efficiency is moving from a "nice-to-have" to a key purchasing criterion, directly lowering a major OPEX line item. Discuss your sustainability roadmap with your to ensure the line's flexibility.
6.3 Flexibility for Product Diversification: Adding Sanitary Pad Production
Market resilience comes from diversification. Many investors are looking at integrated production of baby diapers and . The cost implication: investing in a line that can be easily converted with a changeover kit (additional modules for wing-forming, different adhesive patterns) is far more economical than buying two separate lines. It optimizes factory space, shares utility infrastructure, and allows you to follow market demand shifts. When analyzing costs, factor in the premium for this flexibility versus the cost and opportunity loss of a single-product line.
7. The Procurement Toolkit: A Buyer's Actionable Checklist
Turn analysis into action with these practical tools.
7.1 Pre-Purchase Due Diligence Checklist (10 Key Points)
1. Financial Model Completed: ROI calculated with sensitivity analysis.
2. Factory Site Prepared: Floor plan, power, air, and humidity control verified.
3. Supplier Shortlisted: Minimum of 3 qualified manufacturers evaluated.
4. References Checked: Contacted 2-3 existing clients in similar markets.
5. Factory Audit Conducted: Virtual or in-person visit to assess manufacturing capability and quality control.
6. Total Quotation Compared: All-inclusive price (CIF/DDP, installation, training) from each supplier.
7. Technical Specifications Verified: Speed, yield, power consumption, compliance standards.
8. After-Sales Plan Reviewed: Detailed spare parts list, warranty terms, and support SLA.
9. Payment Terms Negotiated: Milestone-based payments tied to delivery, installation, and performance tests.
10. Contract Reviewed Legally: Clear clauses on performance guarantees, liability, and dispute resolution.
7.2 Negotiation Levers: Where to Push and Where to Hold Firm
– Negotiable: Extended warranty period, inclusion of a larger initial spare parts kit, free online training modules, minor configuration upgrades.
– Non-Negotiable: Core machine quality and construction materials, adherence to safety standards, clarity on performance guarantee metrics (e.g., output, waste percentage), and the supplier's commitment to post-sale support structure.
Remember, the cheapest initial price often leads to the highest lifetime cost. Negotiate for value, not just price reduction.
7.3 Post-Installation Audit Template for Performance Verification
Once the line is installed, verify it meets the guaranteed performance before final payment. Conduct a 72-hour continuous production run and measure:
– Stable Output Speed: Does it consistently hit the guaranteed PPM?
– Reject Rate: Count defective products. Should be below the guaranteed threshold (e.g., <1%).
– Energy Consumption: Use meters to record total kWh consumed during the test.
– Downtime: Record any unplanned stops and their causes.
Document everything. This audit is your final quality gate and leverage to ensure any deficiencies are corrected by the supplier.
8. Legal, Safety, and Compliance: The Non-Negotiable Cost Factors
Ignoring these areas can result in catastrophic financial and reputational loss.
8.1 International Standards (CE, ISO) and Local Import Regulations
CE marking (for the European Union) indicates conformity with health, safety, and environmental protection standards. While your market may not require CE, a machine built to CE standards typically signifies a higher baseline of safety and quality. Additionally, ensure the machine complies with your country's specific import regulations for electrical equipment, which may require local certification body approvals. The cost of non-compliance—re-exporting the machine, retrofitting—is prohibitive.
8.2 Factory Audits and Supplier Verification: Protecting Your Capital
Before transferring any significant payment, conduct a supplier audit. This due diligence is a critical cost-saving step. Look for:
– Manufacturing Capability: Are they assembling from bought-in parts or do they have in-house machining for core components? In-house control usually means better quality and faster spare parts supply.
– Quality Management System: Do they have ISO 9001 certification? It's a proxy for process discipline.
– Financial Stability: Is the company solvent? A bankrupt supplier means no warranty support.
You can request these audits or use third-party inspection services. The cost of the audit is minor compared to the risk of partnering with an unreliable manufacturer.
8.3 Warranty, Service Contracts, and Liability: Reading the Fine Print
The warranty document is a key financial instrument. Standard warranty is often 12 months after commissioning or 18 months after shipment, whichever comes first. Key questions:
– What is covered? Typically, defects in materials and workmanship. Wear parts (belts, blades) are often excluded.
– Performance Guarantee: Is there a clause guaranteeing output, speed, or yield? What are the remedies if not met (e.g., monetary penalty, machine upgrade)?
Consider negotiating a multi-year comprehensive service contract after the warranty expires. This fixes your maintenance costs and ensures priority support.
Investing in a fully automatic diaper production line in 2026 is a complex but highly rewarding endeavor when approached with rigorous analysis. The journey from cost breakdown to ROI calculation, through avoiding common pitfalls and future-proofing your technology, demands a partnership with a knowledgeable and reliable manufacturer. This analysis is not merely about purchasing a machine; it's about acquiring a production system that will be the engine of your profitability for the next decade. Let this guide serve as your foundation. We urge you to take the next step: use the provided checklist to evaluate your plans, and then engage in detailed, technical discussions with potential suppliers. Request a customized, all-inclusive quotation and a performance guarantee based on your specific market data. The most successful investors are those who marry financial acumen with deep technical due diligence.